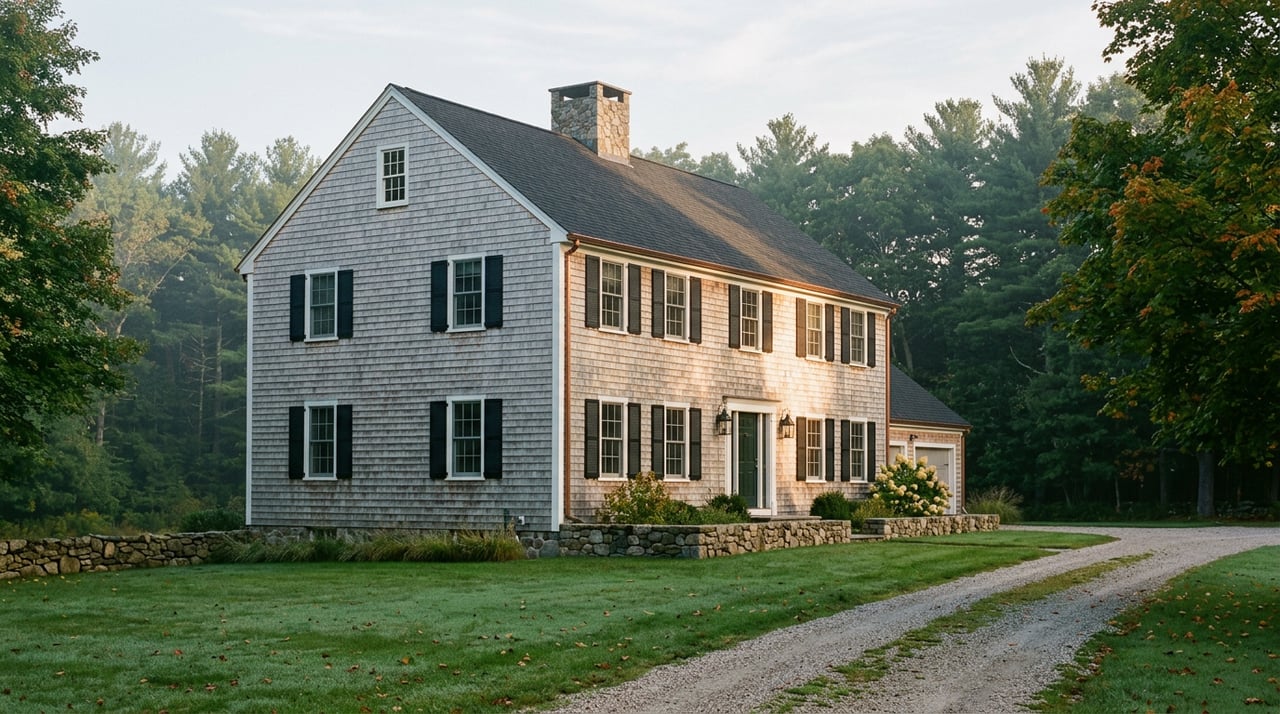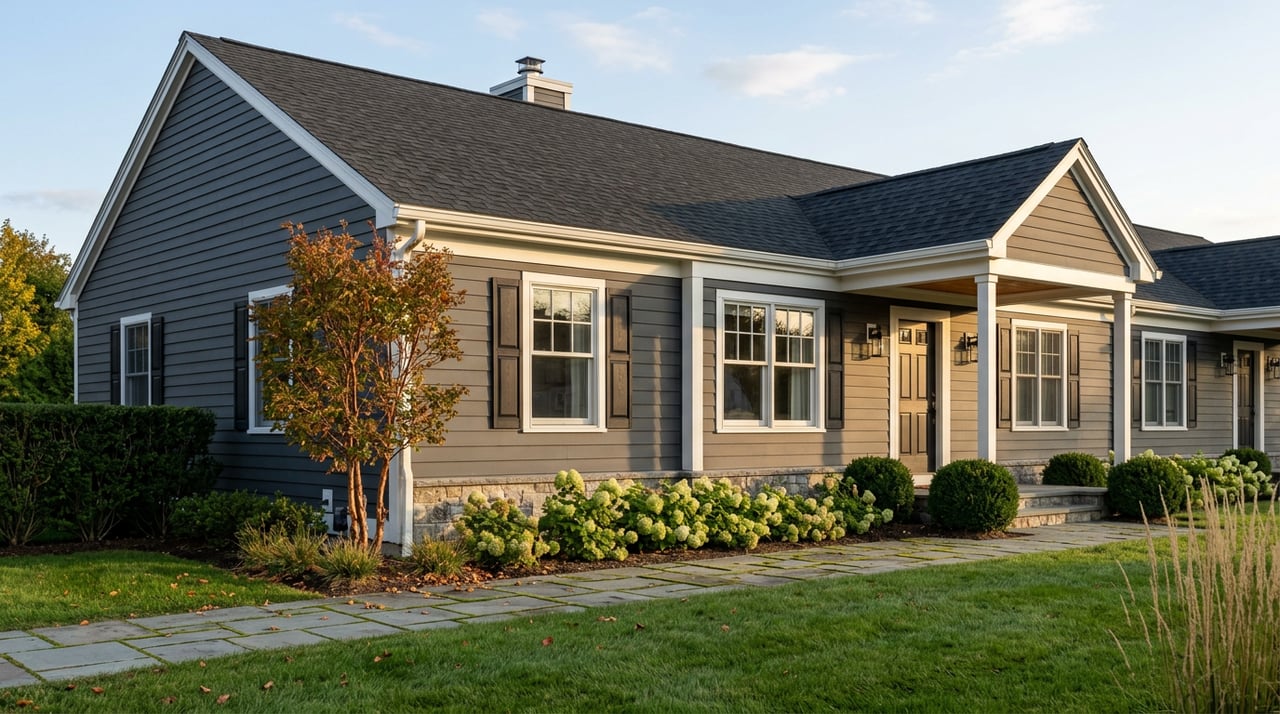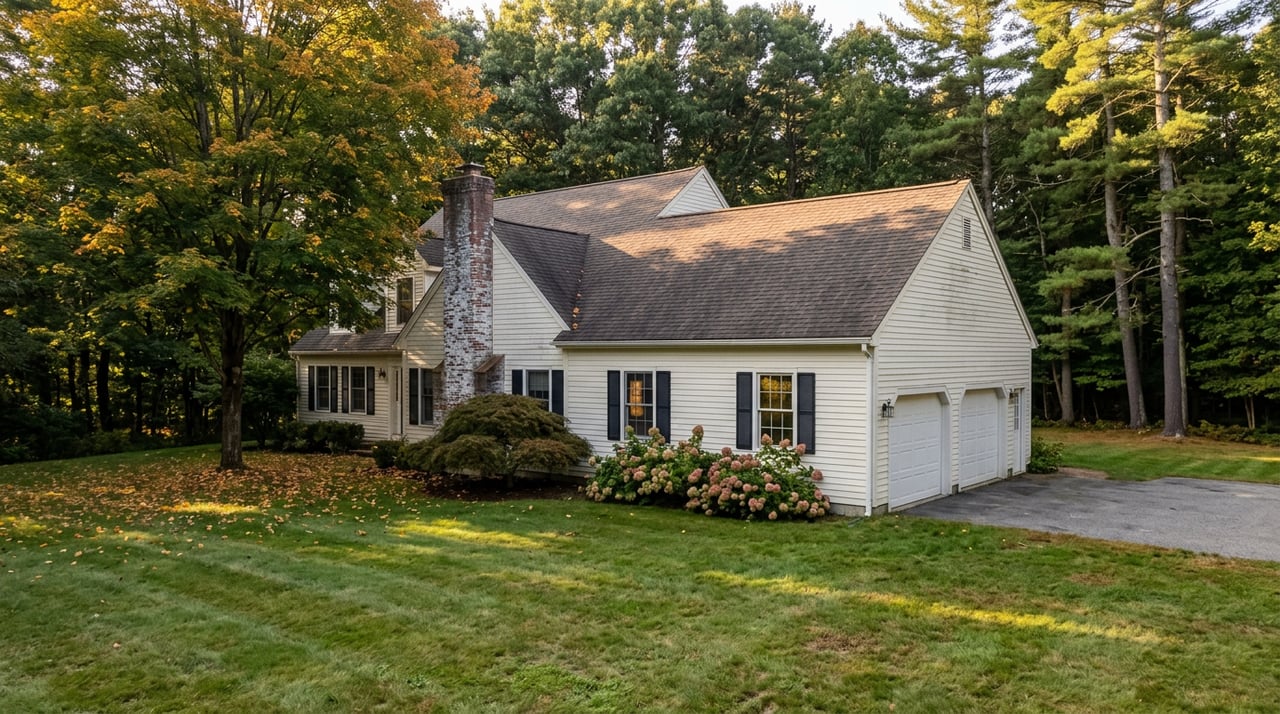
Between July 28 and July 31, 2026, eight homes closed in Bedford's 03110 zip code. The cheapest sold for $420,000, a two-bedroom on Mack with 1,508 square feet. The most expensive sold for $1,915,000, a five-bedroom on County with 5,872 square feet. That's a spread of nearly $1.5 million inside a single four-day window, in one town, one zip code, one Multiple Listing Service feed.
One of those closings, a three-bedroom on Birchwood that sold for $960,000, ran through our own brokerage, Duston Leddy Real Estate. We watched it happen from the inside. And the honest truth is that no single number, no matter how carefully calculated, was ever going to describe both that Birchwood sale and the $420,000 Mack closing in the same breath.
A Week That Breaks the Average
Here's what actually closed that week, straight from public MLS records.
| Street | Sale Price | Beds/Baths | Square Feet | Closed |
|---|---|---|---|---|
| Mack | $420,000 | 2/1 | 1,508 | Jul 29 |
| New Boston | $792,000 | 4/3 | 3,327 | Jul 31 |
| Brick Mill | $875,000 | 4/3 | 4,064 | Jul 30 |
| Birchwood | $960,000 | 3/3 | 3,330 | Jul 28 |
| Amber | $1,075,000 | 4/3 | 3,631 | Jul 31 |
| Mill Stone | $1,400,000 | 4/4 | 3,961 | Jul 31 |
| Spring Hill | $1,600,000 | 5/6 | 4,848 | Jul 29 |
| County | $1,915,000 | 5/5 | 5,872 | Jul 31 |
Average those eight sales and you get roughly $1,130,000. Take the middle two and average them for a median and you land near $1,017,500. Both numbers are arithmetically correct. Neither one describes a single house that actually sold that week. The $420,000 buyer and the $1,915,000 buyer were not competing for the same property, the same street, or the same kind of ownership experience. They were just both, technically, in Bedford.
This is the thing every headline median glosses over: Bedford's market isn't one distribution with a lot of noise around a center point. It's several distinct markets that happen to share a mailing address.
Why Two Different Sites Will Show You Two Different "12 Days"
Anyone who has cross-referenced Bedford listings across a few sites has probably noticed the numbers don't agree, and it's not because someone made an error. As of May 19, 2026, one local market snapshot put Bedford's median days on market at 12, based on homes that had actually gone under contract and closed. As of a live inventory pull on July 27, 2026, the same town's 46 active listings were averaging 60 days on market.
Both figures are honest. They're just measuring different populations. A closed-sale median only counts the homes that succeeded, the ones priced and presented well enough to move fast. An active-listing average includes everything still sitting, including the overpriced or dated homes nobody has offered on yet. Stack those homes into the average and the number climbs, not because the market slowed down, but because slow listings pile up in the numerator while fast ones cycle out.
If you're planning a Bedford purchase and you see a "days on market" figure anywhere, ask which population it's counting. A 12-day median tells you how fast the winners moved. A 60-day average tells you how long today's shelf includes losers that haven't sold yet. Neither one alone tells you what your specific offer, on your specific house, needs to look like.
The Price Bands Hiding Inside the Median
Reported in spring 2026, and still holding up against July's closed sales, Bedford's price geography breaks roughly into these bands:
- Pulpit Estates, on the town's west side off Pulpit Road, runs large colonials on one-acre-plus lots, generally trading between $850,000 and $1.5 million. Turnover here is light. People move in and stay.
- Cote d'Or is one of Bedford's smallest, most private enclaves, with custom homes on dramatic lots typically priced from $1.4 million to $2.5 million or more. Inventory here rarely turns over at all.
- Randolph Woods, on the town's south side, mixes updated 1980s contemporaries with true custom builds, generally landing between $750,000 and $1.2 million.
- The Mews offers Bedford's lowest entry point into single-family or low-maintenance townhouse living, typically $550,000 to $800,000.
- The streets radiating from the historic center along North Amherst Road and Bedford Center Road hold older capes and antique colonials on smaller, more established lots, often opening around $500,000 to $700,000 for a well-located three-bedroom.
Set those bands next to July's actual closings and the pattern holds almost exactly. The $420,000 Mack sale and the $1,915,000 County sale aren't outliers breaking the model. They're the model working correctly, showing two ends of a town that was never one price tier to begin with.
What Your Monthly Bill Actually Depends On
Bedford's 2025 total property tax rate was $16.49 per $1,000 of assessed value. A home assessed at $600,000 carries a tax bill near $9,894 a year. A home assessed at $1.5 million carries a bill closer to $24,735. Same town, same rate, very different monthly reality once you fold that into a mortgage payment. Bedford has additional revaluation work scheduled for 2026, so that rate and the assessed values behind it may shift again once the town finalizes new figures. Anyone comparing carrying costs across price bands should confirm the current assessment on a specific property rather than assuming last year's number holds.
Reading Bedford Like You Actually Live Here
- Find your real band first. Don't anchor on the town-wide median. Ask which of the price tiers above your target square footage and lot size actually falls into, then look at recent closings inside that band specifically.
- Check days on market inside your band, not across the whole town. A house sitting at $1.4 million for 45 days is a completely different situation than a house sitting at $650,000 for 45 days.
- Run the tax math on the actual assessed value, not the rate alone. The rate looks similar across price points. The bill does not.
- Treat any single "Bedford median" you see quoted online as directional, not decisive. If it disagrees with three other sites, that disagreement is the more honest signal.
Two Questions Worth Answering Directly
Why do different real estate sites show different Bedford medians? Because they're pulling from different snapshots. Some report active list prices, some report closed sale prices, some average and some take a true median, and the underlying pool of homes changes week to week in a town this bifurcated by price band. A $772,000 average and a $1.26 million median list price can both be correct at the same moment, describing different slices of the same inventory.
Is Bedford's market slowing down? The under $700,000 segment remains the most competitive in town, with well-priced homes there still drawing fast interest. Above $1.2 million, buyers generally get more room to negotiate, inspect, and take their time. That's not a town-wide slowdown. It's the same bifurcation showing up in buyer behavior instead of price.
If you're trying to figure out which Bedford price band actually fits your budget, or you're preparing to list a home and want a pricing strategy built around your specific street and square footage rather than a town-wide headline, Lawrence Home Group can walk through the real comparables with you. Contact Us when you're ready for a conversation grounded in your address, not an average.